In March I spent a weekend running test queries through Power BI Copilot on a Fabric F2 capacity, reviewing the diagnostic JSON to understand how to improve my reports. One of those diagnostics is the reason for this post. When I asked a question about product growth trends, the answer had taken 107 seconds to arrive. The DAX query behind it executed in 173 milliseconds. The other 106.8 seconds was LLM overhead, and the why didn’t exist outside of the diagnostics.
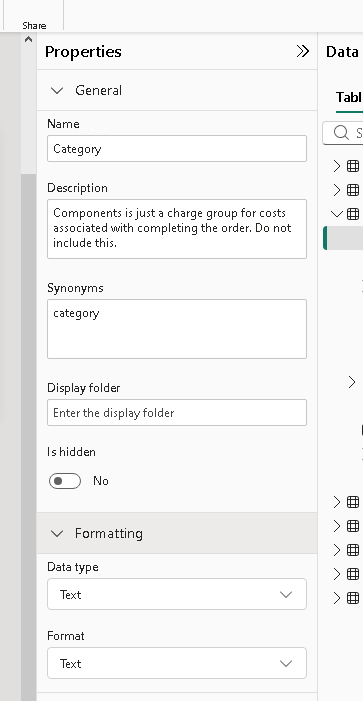
Copilot tackles a data question in two tiers. A semantic parser gets the first shot, matching your words against the model’s tables, columns, and relationships, and it plays by the model’s rules, so a column marked Hidden (IsHidden = 1) might as well not exist. My question needed Product[Category], which I had hidden. Refused. The question dropped through to the second tier, an LLM that writes DAX from scratch.
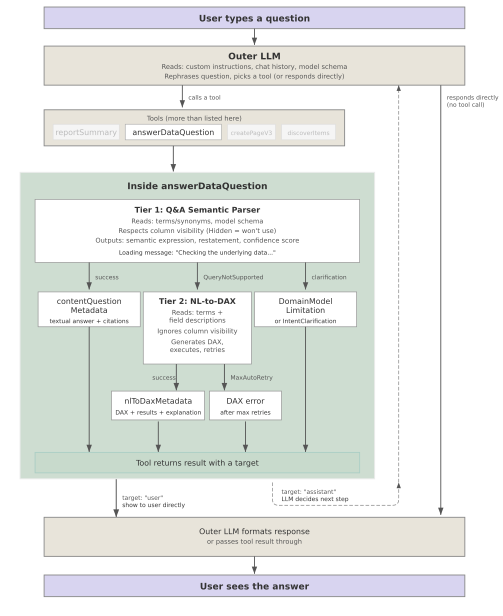
The DAX generator has auto-retry logic. If the generated DAX fails to execute, it tries again with a different approach, up to a limit. Mine hit the limit:
"activityDetails": {
  "fallbackReason": "queryNotSupported"
},
"daxExecution": {
  "autoRetryCount": 2,
  "notRetryableReason": "MaxAutoRetry",
  "executeDaxDuration": 172.5
},
"generateDaxDuration": 106814.5
Three generation attempts, each with its own token cost. The first produced invalid GROUPBY DAX. The second tried a join with no common join columns. The third ran. Interestingly, the DAX generator does not respect column visibility the way the parser does (Microsoft’s documentation mentions this). The generated DAX reached the hidden Product[Category] through TREATAS without complaint. The tier that honors your configuration refused the question. The tier that ignores your configuration billed three attempts and then answered using the column you hid.
Four Layers
The reflex is to blame the question. Growth trends means comparing periods, comparing periods means real DAX, expensive question, expensive answer. The diagnostic says otherwise. A question of comparable complexity on the same model, five tables, three filters, three aggregations, resolved through the parser in about 2 seconds. The price didn’t come from what I asked. It came from a checkbox in the model view, and between that checkbox and the invoice there are four layers a user can’t see through.
They can’t see the visibility flags. IsHidden lives in the model properties, set by whoever built the semantic model, possibly years ago, possibly for cosmetic reasons. Hiding a column is how you tidy a field list. Nobody hides a column thinking they’re routing future questions to the expensive tier.
They can’t see which tier is handling the query. There is a tell, the loading message switches from “Checking the underlying data” to “Generating a DAX query,” but it only reads as a tell if you’ve been in the diagnostics. To everyone else it’s a progress message with vocabulary.
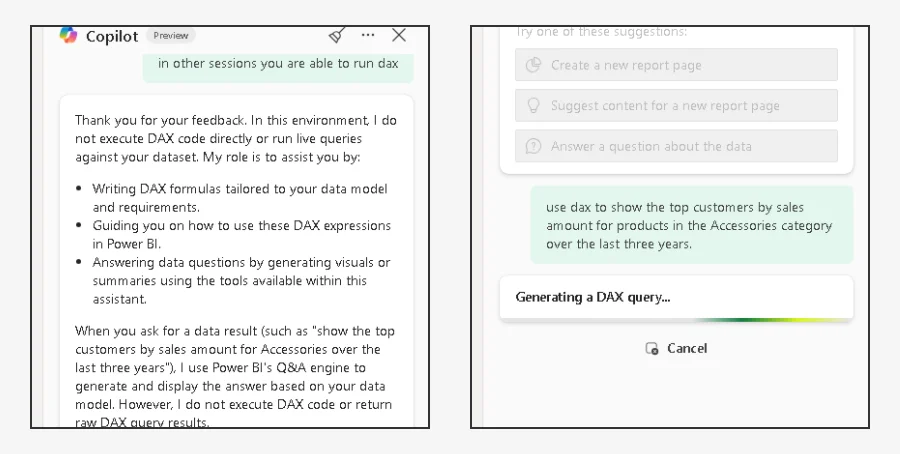
They can’t see the retries. Three generations happened behind one spinner. The UI shows a wait, not an attempt count, and each attempt carried its own tokens at Copilot’s rates, 100 CU seconds per 1,000 input tokens and 400 CU seconds per 1,000 output tokens.
And they can’t see the cost land. Copilot operations are classified as background jobs, so they get spread across 24 hours. The 400 CU seconds from one query gets divided into roughly 16.67 CU seconds per hour across the next day. By the time consumption is visible in the Capacity Metrics app, the question, the retries, and the hidden column are a day in the past. The Capacity Metrics app is retrospective, not preventive.
Four layers, one property. Everything that determines the price sits upstream of anything the person paying can observe. The cost of a Copilot query is coupled to model hygiene, and model hygiene is invisible from the chat pane.
Why the Estimate Missed
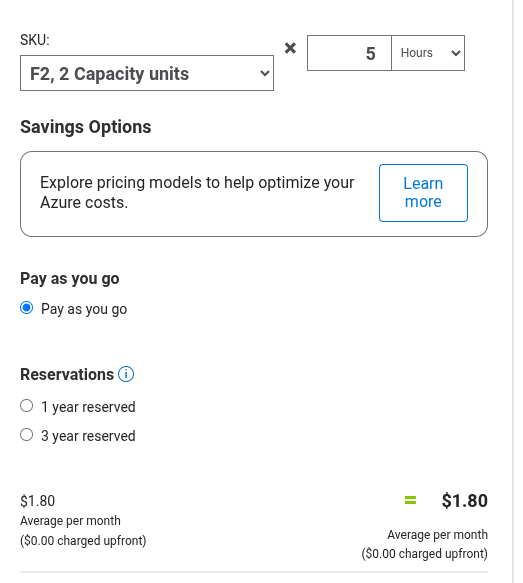
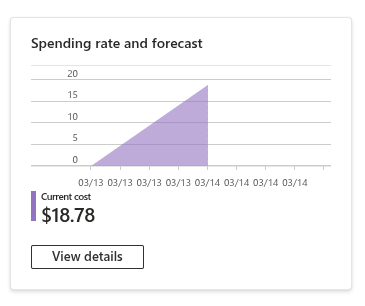
Before that weekend I went into the Azure calculator, pulled up the resource usage, all told would be no more than $5.00. The bill came to $18.78, and at the time I filed the gap under salespeople. That was unfair. The calculator estimates provisioned capacity, and it got that part right. The F2 itself cost $1.80 for the hours I ran it. The rest was consumption, and consumption is retry behavior multiplied by token counts. Retry behavior is determined by whether the semantic model gives the parser a clean path. No estimator can price whether somebody hid a column three weeks before you typed your question.
What the System Does
The purpose of a system is what it does. Nobody at Microsoft sat down and designed a meter that charges people for a checkbox they can’t see. The parser honors visibility because that’s the whole point of visibility. Retries exist because a second attempt beats an error message, and the smoothing is there to protect shared capacity from bursts. Every one of those choices is defensible on its own. Chain them together and you get a machine that spends 107 seconds of paid reasoning on a hidden column, then scatters the evidence across the next 24 hours. Configuration is priced in. Nobody sees the price until it’s been paid.
The full pipeline teardown, with the diagnostic exports all of this comes from, is in Looking Under the Hood for Power BI Copilot.
Leave a Reply