I passed DP-600. Below is a setup I had for making a Fabric F2 Capacity for personal testing with a limited blast radius. Headers so you can skip sections that aren’t relevant.
Background
A lot of companies only use part of Fabric, so getting experience with the whole ecosystem can be tough. I’m more familiar with Databricks for engineering/ML, and Fabric for dataflows, Power BI, and Copilot. There’s some serious strengths in an overlapping Databricks/Fabric ecosystem (for a future post), but since Fabric is designed to be end-to-end, some of the more Microsoft-specific exam components including its eventstream implementation, dataflows writing into a lakehouse, domains, and Fabric Python libraries weren’t part of my day-to-day stack.
It’s possible to set up Fabric for cheap on Azure, less than a dollar an hour, pennies when you pause it. Fabric is also a single resource that is contained, no worrying about making networking and external storage pieces mix together by default, so it’s super easy to provision and manage through the front-end. I use Terraform for other hosts (Ramnode, Railway, and Backblaze being some of them), but only when there’s a hard spending cap. None of my personal machines will ever have api or terminal access to anything with unlimited spending.
With pay-as-you-go on Azure, there’s no hard spending cap. You sign an agreement saying you’re going to pay for the resources you provision. I’ve read horror stories about people being on the hook for a $40k gpu mining operation on their account, or leaving an expensive service running. I love Azure and fear it in equal measures. I think that’s healthy.
Okay, so the setup.
Objects
At a high level there’s two administrator accounts. One as a global admin in entra, one as an admin in Azure in case for some reason the global admin was locked out and there was a resource still online.
Entra
I created these accounts. The admin and analyst aren’t strictly needed. Analyst is useful if you want to test out role based access controls, which the exam covers. Contributor and above roles in Fabric workspace can sidestep some of the rules, so it’s useful to have someone where you can see what it looks like from their perspective.
me@my_domain.onmicrosoft.com: card and billing relationship
admin@my_domain.onmicrosoft.com: global admin, subscription owner
jonathan@my_domain.onmicrosoft.com: daily account, capacity admin and operator role (custom role created, more below)
analyst@my_domain.onmicrosoft.com: test identity, no admin roles
In entra, I enforced MFA and created the four accounts. Set them up one at a time.
Fabric
In https://app.fabric.microsoft.com/, I signed in with admin, jonathan, and analyst to set up their free accounts. Admin is required to sign in so it can create the capacity.
Azure
Single subscription fabric-test, created by admin, signed in private mode on my browser. The me and admin accounts are kept signed out. These are the only two accounts that can create subscriptions.
In fabric-test I created the objects:
Policies: allowed resource types (Fabric capacities, action groups, and activity log alerts), allowed locations (eastus), and a custom F2-only SKU rule.
Logging and alerting:
Catch-all activity log alert rule
Action group for emailing my account
Budget alerts
Fabric F2 capacity, created with jonathan as the admin.
The custom Azure Fabric operator role has Read Fabric capacity, suspend Fabric capacity, and resume Fabric capacity. It’s assigned to jonathan, the account that stays signed in. It’s upper limited at about $260 a month. The built-in contributor grant would let it create more F2 capacities, so that was out, since the policy limits size and not count.
Capacity admin and the operator role are separate systems. Capacity admin is a Fabric setting that lets jonathan assign workspaces to the capacity. Pausing is an Azure action, so it needs the custom role too.
If you use Copilot, you might come up against capacity limits (I’ve written about it here, here, and here). If you’re comfortable you can widen the SKU limits to F2-F4, allow write, and scope the role to a single existing capacity.
Daily driver can spend money, but it’s capped above by simply leaving the Fabric capacity online. Annoying more than devastating.
Guardrails
MFA
Subscription is locked down to a single paying resource
Anyone who can create resources is signed out by default, only accessed from ephemeral sessions
The only user that is capable of triggering spend is limited by about $260 a month
Every change to an Azure resource triggers a log alert email
Budget alerts at $5, $20, and $50
Final
So that’s the setup that’s worked for me. The holes I know about: admin and me can remove the policies, so if either is compromised there’s no cap, and budget alerts lag about a day behind spend. Let me know the other holes you see.
Fabric is much wider and more capable than I had imagined in my prior roles. A lot of headaches I had about Power BI, thinking Microsoft did something backwards, were actually “no, that’s not what that tool is for.” Knowing how Microsoft conceptualizes its system makes it easier to understand how to coordinate with other tools, like Databricks. While certification without use can be hollow, use without certification can lead to misunderstandings.
In March I spent a weekend running test queries through Power BI Copilot on a Fabric F2 capacity, reviewing the diagnostic JSON to understand how to improve my reports. One of those diagnostics is the reason for this post. When I asked a question about product growth trends, the answer had taken 107 seconds to arrive. The DAX query behind it executed in 173 milliseconds. The other 106.8 seconds was LLM overhead, and the why didn’t exist outside of the diagnostics.
Copilot tackles a data question in two tiers. A semantic parser gets the first shot, matching your words against the model’s tables, columns, and relationships, and it plays by the model’s rules, so a column marked Hidden (IsHidden = 1) might as well not exist. My question needed Product[Category], which I had hidden. Refused. The question dropped through to the second tier, an LLM that writes DAX from scratch.
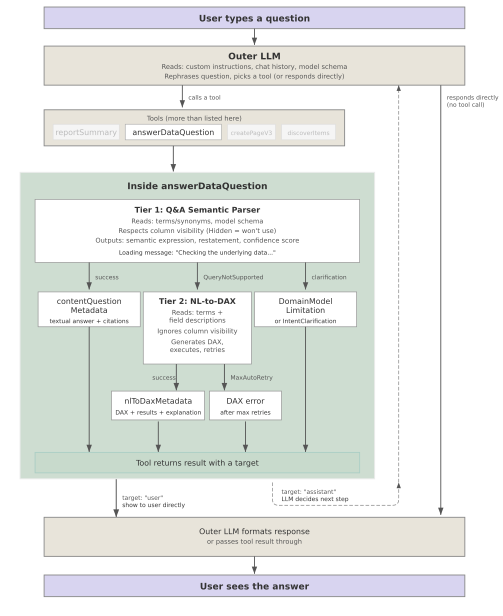
The two tiers inside answerDataQuestion. Tier 1 respects column visibility. Tier 2 doesn’t.
The DAX generator has auto-retry logic. If the generated DAX fails to execute, it tries again with a different approach, up to a limit. Mine hit the limit:
Three generation attempts, each with its own token cost. The first produced invalid GROUPBY DAX. The second tried a join with no common join columns. The third ran. Interestingly, the DAX generator does not respect column visibility the way the parser does (Microsoft’s documentation mentions this). The generated DAX reached the hidden Product[Category] through TREATAS without complaint. The tier that honors your configuration refused the question. The tier that ignores your configuration billed three attempts and then answered using the column you hid.
Four Layers
The reflex is to blame the question. Growth trends means comparing periods, comparing periods means real DAX, expensive question, expensive answer. The diagnostic says otherwise. A question of comparable complexity on the same model, five tables, three filters, three aggregations, resolved through the parser in about 2 seconds. The price didn’t come from what I asked. It came from a checkbox in the model view, and between that checkbox and the invoice there are four layers a user can’t see through.
They can’t see the visibility flags. IsHidden lives in the model properties, set by whoever built the semantic model, possibly years ago, possibly for cosmetic reasons. Hiding a column is how you tidy a field list. Nobody hides a column thinking they’re routing future questions to the expensive tier.
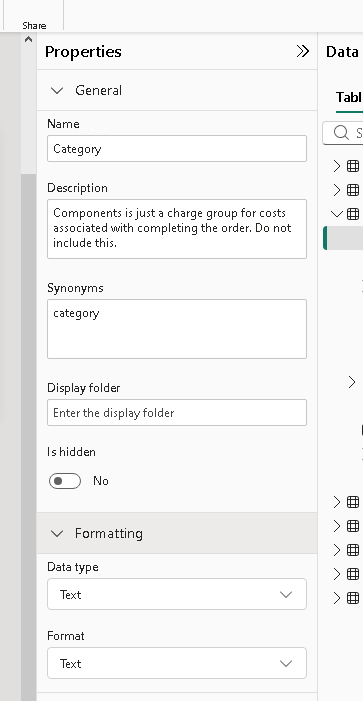
Where IsHidden lives. One toggle in the model’s Properties pane.
They can’t see which tier is handling the query. There is a tell, the loading message switches from “Checking the underlying data” to “Generating a DAX query,” but it only reads as a tell if you’ve been in the diagnostics. To everyone else it’s a progress message with vocabulary.
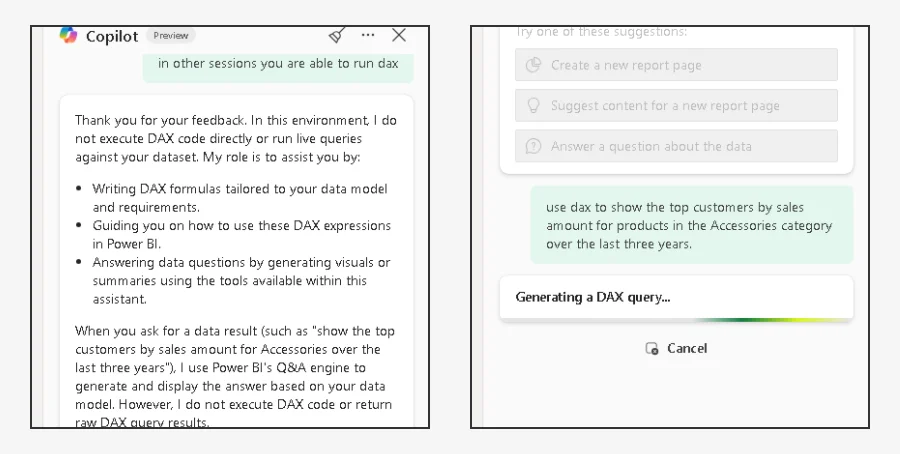
Left: the outer LLM insisting it doesn’t run DAX. Right: the fallback tier generating DAX. Same product.
They can’t see the retries. Three generations happened behind one spinner. The UI shows a wait, not an attempt count, and each attempt carried its own tokens at Copilot’s rates, 100 CU seconds per 1,000 input tokens and 400 CU seconds per 1,000 output tokens.
And they can’t see the cost land. Copilot operations are classified as background jobs, so they get spread across 24 hours. The 400 CU seconds from one query gets divided into roughly 16.67 CU seconds per hour across the next day. By the time consumption is visible in the Capacity Metrics app, the question, the retries, and the hidden column are a day in the past. The Capacity Metrics app is retrospective, not preventive.
Four layers, one property. Everything that determines the price sits upstream of anything the person paying can observe. The cost of a Copilot query is coupled to model hygiene, and model hygiene is invisible from the chat pane.
Why the Estimate Missed
The estimate.
The bill.
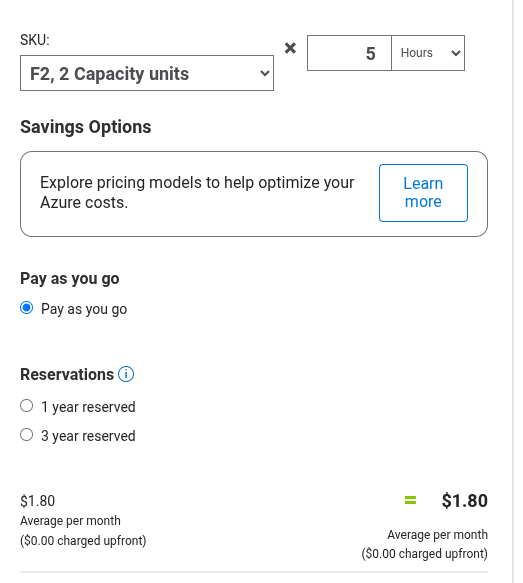
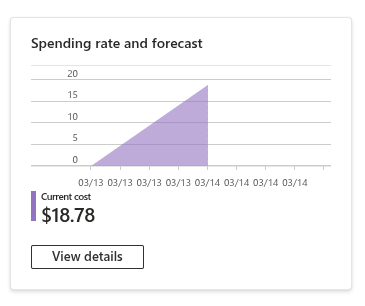
Before that weekend I went into the Azure calculator, pulled up the resource usage, all told would be no more than $5.00. The bill came to $18.78, and at the time I filed the gap under salespeople. That was unfair. The calculator estimates provisioned capacity, and it got that part right. The F2 itself cost $1.80 for the hours I ran it. The rest was consumption, and consumption is retry behavior multiplied by token counts. Retry behavior is determined by whether the semantic model gives the parser a clean path. No estimator can price whether somebody hid a column three weeks before you typed your question.
What the System Does
The purpose of a system is what it does. Nobody at Microsoft sat down and designed a meter that charges people for a checkbox they can’t see. The parser honors visibility because that’s the whole point of visibility. Retries exist because a second attempt beats an error message, and the smoothing is there to protect shared capacity from bursts. Every one of those choices is defensible on its own. Chain them together and you get a machine that spends 107 seconds of paid reasoning on a hidden column, then scatters the evidence across the next 24 hours. Configuration is priced in. Nobody sees the price until it’s been paid.
This is a companion piece to Looking under the hood for Power BI Copilot. In the main post I traced the full pipeline from question to answer, but one of the more practical findings was about the two paths Copilot can take to resolve a data question. One is fast and reliable. The other is slow, expensive, and prone to hallucination. Which path you land on depends on how your model is set up and how you phrase the question.
Two tiers, one question
When you ask Copilot a data question through answerDataQuestion, it first tries a semantic parser. This is a structured query engine that resolves your question against the model’s relationships, column names, and hierarchy levels. In the UI, you’ll see “Checking the underlying data…” while it works. The query I described in the main post (warehouse clothing sales in the US by month, joining five tables with three filters and three aggregations) resolved in about 2 seconds through this path.
If the parser can’t handle the question, Copilot falls back to generating DAX with an LLM. The UI shifts to “Generating a DAX query…” and the wait gets longer. One of my test queries took 107 seconds to generate DAX, then 173 milliseconds to execute it. The bottleneck isn’t running the query; it’s writing it. And because it’s freeform code generation, the results are less predictable.
So the practical question becomes: what keeps you in the first tier?
What the parser handles
The parser is good at questions that map to a single pass over the data with grouping, filtering, and basic aggregation. Think of it as roughly equivalent to what you could express in a single SELECT with GROUP BY. From the 24 queries I tested:
Simple aggregations work. “Total sales amount,” “average unit price,” “count of orders.” Filters on specific values work. “Sales in the United States” resolves because the parser matches “United States” to an actual value in the country column. Top N queries have native support; “top 10 customers by sales amount” stays in the fast path. Sorting works in both directions.
Multi-table joins work as long as the tables are connected through your model’s defined relationships. “Sales by customer country” resolves because sale→customer→country follows the relationship chain. The parser also has built-in relative date functions, so “last year” and “this year” work regardless of what dates are actually in your dataset. These are more robust than hardcoded years, which sometimes appeared in Copilot’s own suggested follow-up queries.
What surprised me was how much the parser could combine. That warehouse clothing query joined five tables (sale, reseller, product, sales territory, date), applied three filters (Warehouse, Clothing, United States), computed three aggregations (sum of quantity, average unit price, average discount), sorted by month, and resolved in 2 seconds. All in the fast path.
What falls through to DAX
The boundary is roughly: if the answer requires comparing results across different slices or building on intermediate calculations, the parser can’t express it. Year-over-year growth needs two separate period totals and a comparison between them. Percentage changes need the same. “Which products grew the most AND which declined?” asks for both sides of a ranking simultaneously, which requires multiple passes.
In my testing, every query that involved conditional logic across different analytical dimensions (“products where sales increased but returns also increased”) or multi-step analysis (“average sales for customers who bought more than 10 items”) fell through to DAX generation. The parser is single-pass by design; anything that needs a subquery or self-join is out of scope.
Setting your model up for the fast path
The single highest-leverage thing is descriptive names. The parser resolves natural language against your table, column, and measure names. sales_amount gives it something to work with; sa_amt_v2 does not.
Synonyms on hierarchy levels matter more than I expected. In the main post I documented a case where the parser refused a query about “category” because Product[Category] was hidden, even though the hierarchy level Product → Product → Category was visible. The parser resolves through hierarchy paths, not just columns. Adding a single Terms: ["category"] synonym to the hierarchy level turned a DomainModelLimitation refusal into a working query. One word.
Column visibility is important and asymmetric. The parser respects IsHidden; if a column is hidden, the parser won’t use it and may refuse the query entirely. The DAX fallback tier doesn’t always respect this boundary the same way. I found cases where generated DAX used hidden columns through TREATAS. This is another reason to prefer staying in the parser tier: it actually honors the access controls you set.
Field descriptions have a side effect worth knowing about. Setting descriptions on columns in “Prep data for AI” can trigger auto-generated synonyms. In one case, a field description caused a synonym to appear that made a previously-failing query succeed. The description itself wasn’t what fixed it; the synonym it generated was.
If you know users will ask questions that would normally fall to DAX (year-over-year growth, percentage changes), write measures for them. The parser can use pre-built measures in a single pass, turning a two-tier question into a one-tier question.
Phrasing
Refer to columns and measures by something close to their actual names. “Total sales amount” resolves better than “how much money did we make” if your measure is called Sales Amount. Be specific about filter values: “sales in the United States for clothing” gives the parser concrete strings to match against column values, where “US clothing revenue” requires it to infer that “US” means “United States” and “revenue” means “sales.”
Split compound questions. “What are the top customers and how have they changed over time?” is two questions. The first part stays in the parser; the second (change over time) forces a DAX fallback. Ask them separately and both answers come back faster.
One thing I didn’t expect: conversation context can poison the parser. If a query gets refused in one turn, the refusal persists in the conversation’s context events and can contaminate subsequent queries. I tested the same question in a session where a prior refusal existed and in a fresh session. It failed in the contaminated session; it succeeded in the fresh one. If Copilot starts refusing things it should be able to handle, start a new chat.
How to tell which tier you’re in
Watch the status text in the Copilot pane. “Checking the underlying data…” means the parser is working. “Generating a DAX query…” means it fell through. In the Service (browser) environment you’ll also see a “View DAX query” button when the DAX tier was used. Desktop doesn’t surface this, but the fallback still happens behind the scenes.
If you’re consistently seeing “Generating a DAX query” on questions you think should be simple, that’s a signal to check your model setup: column names, visibility, and synonyms. The parser’s capabilities are wider than you’d expect. Usually when it falls through, the model is the bottleneck, not the question.
Power BI is part of the Fabric ecosystem. Fabric is an end-to-end data platform, including ingestion, warehousing, outflows, and dashboarding, including Copilot for Power BI. The costing for Fabric involves you purchasing capacity units (CU), from F2 for 2, to F2048. Capacity units are measured in seconds. If you have 2 capacity units per second run, then you have 60 seconds available to you per 30 seconds of runtime. When I ran my workspace, I paid for 5 hours x 60 minutes / hour x 60 seconds / minute x 2 capacity units = 36,000 CU-seconds, for a total of $1.80. But that’s not the full story.
Fabric bills Copilot at 100 CU seconds per 1,000 input tokens and 400 CU seconds per 1,000 output tokens. A request with 2,000 input tokens and 500 output tokens consumes 400 CU seconds, about 6.67 CU minutes. An average Power BI Copilot query in my instance ran about 1,500 CU seconds, though summaries have cost more. At the pay-as-you-go rate of $0.18 per CU hour, that’s roughly $0.075 per question. But the CUs come out of the same capacity pool that runs your Spark notebooks, warehouse queries, dataflows, and semantic model refreshes.
Regardless, you’re paying for fixed capacity, if you consume more than that then the service should throttle.
When you open a dashboard in Power BI or run a SQL query, the cost for that is spread out over the next 5 minutes to 24 hours. Copilot operations are classified as background jobs, so they get spread across 24 hours. This helps because it means the capacity you have running idle at 2am takes some of the cost of a burst of user queries at 2pm. This is a good thing.
That also means the 400 CU seconds from one query gets divided into roughly 16.67 CU seconds per hour across the next day. It’s also what makes the cost hard to notice until it accumulates. I ran my Fabric environment for 5 hours, but during that time, fabric was assuming that I would be running it for the next 24 hours.
If you have twenty queries a day from one user, 22 working days a month: about 660,000 CU seconds, 183 CU hours, roughly $33 in shared capacity consumption. Their Power BI Pro license costs $10. A team of ten moderate users on an F64 ($8,400/month) would put about 4% of the entire capacity toward Copilot alone. The remaining 96% handles everything else. The Capacity Metrics app is retrospective, not preventive.
The F2 made all of this visible because there was nothing else running. On a production F64, the same $17 of Copilot consumption would be a rounding error in a monthly bill that’s already four figures. Same cost. Same CUs consumed. Different signal-to-noise ratio.
I spent last weekend testing out Copilot for Power BI. I’ve been using it extensively as a developer, trying to make something that’s useful for people. I’ve been growing more skeptical of all my technical skills.
I went into the Azure calculator, pulled up the resource usage, all told would be no more than $5.00. Salespeople. I made the Power BI report, ran the Copilot queries. Documented the telephone game, deleted the resources.
Now I’m looking at what the telephone game cost. Not much, but for 5 hours for a single user running queries for only a small fraction of that time, a bill for $18.78. How did that happen?
I encountered the same when running my queries in Roo. This isn’t a post about money.
The Telephone Game
I showed in the teardown post that the Copilot pipeline is a chain: outer LLM rephrases the question, Q&A parser tries to match against the semantic model schema, if that fails a DAX generator fires as fallback, results go back to the outer LLM for formatting. Each step consumes CUs. Each retry consumes more.
The 107-second DAX generation with three retries was because a column got hidden in the semantic model. Metadata, not complexity of the ask. The Q&A parser kicked it to the DAX generator, which tried bad DAX three times before giving up. The diagnostic JSON shows all of it. Each attempt had its own token cost.
This is one tradeoff of a multi-agent system. Flashlight on the ground, looking for a problem that falls within its torch-light. Each node in the chain simplifies the problem to something it can solve. If you remove enough context or focus enough detail, anything becomes solvable. This means that four can chain together, with irrelevant details getting amplified. Telephone game.
The Q&A parser is good at what it does. The DAX generator is good at what it does. The handoff between them is where meaning drops out. That’s not a capability problem that gets fixed by making each node smarter. It’s a structural property of chaining agents.
Build vs. Run
The $18.78 bill on a restarted F2 capacity warrants another look, but not as a measure of cost, because if it means not hiring a third data analyst, then $3.70 per hour washes out. The problem is $3.70/hr/user. It runs counter to the trend of the last 40 years. Build vs Run.
Build. When you build a dashboard, it is a capital expense. Build it, done. Whether 5 people or 5,000 people look at it, the marginal cost per user is the same, nearly zero. If you use or rent a GPU, same.
Run. A Copilot query is an operating expense. Every question costs CUs. The more people use it, the more capacity it consumes. Until you invest in infrastructure or reserve capacity, success and cost scale together. Copilot answering “what were sales last month” for the 400th day in a row is going to incur 400 times the cost. The next person who asks pays again. To its credit, Fabric caches identical queries for 24 hours, though in my experience that also means you might get a “sorry Dave” question to multiple users if the first one had somehow triggered a refusal.
In between. I’ve seen people using Claude code to write the MCP tools where the tools exist and are deterministic after. The artifact is created and the marginal cost returns to zero.
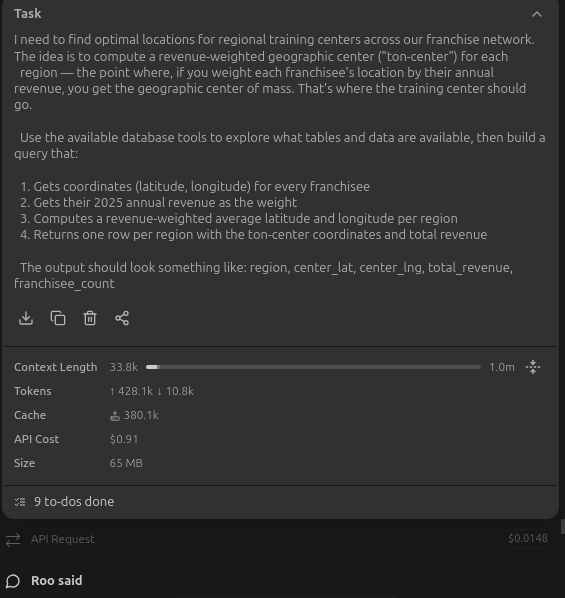
The $0.91 in that Roo screenshot produced a working query and a colleague who now understands the data model. Copilot’s $0.075 produced an answer that evaporated when the session ended.
The Leverage Inversion
I went looking for data on how many people one person’s work typically serves.
Role
Ratio
How it works
Cashier
1:1
Sequential. One customer at a time.
Customer service (phone)
1:1
Synchronous. One call.
Customer service (chat)
1:3-5
Multiplexed. Concurrent sessions.
Nurse (acute care)
1:4-6
ANA recommends max 6 patients.
Teacher (OECD avg)
1:15
One-to-many, synchronous.
IT help desk
1:70-100
Gartner benchmark. Mix of sync and async.
Dashboard builder
1:dozens-hundreds
Asynchronous. Artifact serves people without you.
Software engineer
1:thousands-millions
Code is leverage. WhatsApp: 50 engineers, 1B users.
The low end is Baumol’s stagnant sector. William Baumol and William Bowen, 1966: the string quartet can’t play faster. Four musicians, same duration, every performance. The performer’s labor IS the output. You can’t increase productivity because there’s nothing to optimize away. But wages rise anyway because the progressive sector (manufacturing, tech) pulls them up. So the cost of live performance, healthcare, education rises without the work itself changing, called Baumol’s cost disease.
Software was supposed to escape this. Build once, serve at scale. Zero marginal cost of replication. Naval Ravikant calls code “permissionless leverage”: it works for you at scale without needing anyone’s permission. WhatsApp served 42 billion messages daily with a team that fit in a conference room. That’s what breaking out of the string quartet looks like.
The consumption model puts something interesting on the table. The “performance” (the query, the generation, the agent session) has a real cost every time it runs. A dashboard builder at 1:500 creates an artifact once and it serves viewers indefinitely. Copilot answering questions about that same dashboard is a separate interaction for each person, each question. The leverage ratio looks different.
“Pay for what you use” was cloud computing’s promise, and it was a good one. The meter was on your infrastructure. A VM you spun up, controlled, sized, shut down. This meter is on something else. Every person who asks a question, anywhere in the org, adds to the same shared capacity pool. The consumption is emergent. It’s the aggregate of individual curiosity across the entire company, billed to a shared resource nobody is watching at the question level.
Google handled this differently. Gemini is bundled into all Workspace plans at a flat rate, $7-26/user/month depending on tier. Prices went up 16-22% when Gemini was added. No per-query metering. Everyone pays whether they use it or not. Microsoft gives you the per-query meter but lets you opt out by not enabling Copilot. Different risk transfer models for the same underlying cost. When employees have access to both Copilot and ChatGPT, 76% choose ChatGPT. Both companies’ real moat is forced bundling with the productivity suite.
The Design Question
The consumption cost is proportional to how much reasoning you’re asking the LLM to do per interaction. That much seems clear from the data.
Copilot’s Q&A parser tier is a good example. Cheap pattern matching handles the easy stuff. If the user asks “what were total sales last month” and the semantic model has a measure for that, it matches directly. The LLM only fires on fallback. That tiered design keeps the per-interaction cost low for the 60-70% of questions that are straightforward. The same principle shows up in the MCP: five deterministic tools, the LLM picks which one and interprets results. Most of the work is in the tool, not the reasoning.
Contrast that with overly broad agent instructions. “You are a helpful data analyst, figure it out” with a dozen tools. The LLM is in the hot path for everything. Every instruction that could have been a tool, every decision that could have been a rule, every piece of context that could have been in the schema metadata, that’s reasoning you’re paying for per query.
People at my company are building Copilot Studio agents that encode their instructions into a prompt. That’s middle management in a different medium. Compare that to a coworker who wrote a script that bundles an entire repo into a file you can paste as context to an agent, with response parsing built in. One fills the existing pattern. The other gives people something they didn’t have before.
The “just make an agent” thing. A virtual employee that can be cloned infinitely sounds like an advantage until you notice that everyone else can clone one too. If the advantage can be replicated at marginal cost, it’s table stakes within six months. The question underneath that: what work stays valuable when everyone has agents?
Where I keep landing: general-purpose insight extraction layered on specific artifacts. Build a table, the AI uses it to answer a range of questions. Build a Gantt chart, the AI applies it to a suite of problems. The artifact is still the leverage. The AI is an interpretation layer on top. My colleague isn’t valuable because he has an agent. He’s valuable because he understands the business well enough to know which questions to ask and whether the answers make sense.
This isn’t only about LLMs either. World models, spatial reasoning, domain-specific architectures for things like protein folding. None of these are LLMs and all of them are moving fast. Yann LeCun left Meta and raised over a billion dollars betting that LLMs “will become useless within five years.” Whether he’s right about that is a different post. The design principle is the same regardless: minimize the expensive reasoning surface area, build specific tools underneath. If you build around a model type, you’re locked in. If you build around the principle, the reasoning layer is swappable.
The Turn
“Is It Okay” ended uneasy. The meter doesn’t help with that.
But the Power BI tool is important. It lets people find insights faster than I could. I’m not the bottleneck anymore. My colleague learned the domain through the MCP in ways he couldn’t have without it. He’s finding discrepancies nobody had surfaced before. That’s real. The MCP isn’t designed to teach him the business, but that’s what it does.
I entered the workforce at a time where the challenge was how to survive in a world where the model was front-load on education and hope it translates to experience before you retire. Drucker’s knowledge worker problem. Continuous learning as the strategy. Now I’m in a world where finding information is cost zero, but finding context is the whole game. The strategy was continuous learning. What’s the model for continuous experience?
Jack Dorsey cut Block from 10,000 to 6,000 employees and shipped 40% more production code per engineer. Tobi Lutke told Shopify employees to prove AI can’t do a job before asking for headcount. Salesforce stopped hiring software engineers. The investment thesis is headcount reduction. The “augmentation” framing and the “replacement” framing aren’t in tension. They’re the same companies saying both things in different rooms.
McKinsey says 6% of enterprises qualify as “AI high performers.” PwC says 56% of CEOs report AI has produced neither increased revenue nor decreased costs. S&P Global says 42% of companies abandoned most AI initiatives in 2025. IBM found that GenAI ROI averaged 31% in pilots but collapsed to 7% when scaled, below the typical 10% cost-of-capital hurdle. These numbers don’t mean AI doesn’t work. They mean the deployment model matters, and most organizations haven’t figured it out yet.
Both things are true at the same time. The consumption model changes the economics. And the tools let people do work that wasn’t possible before. There’s a version of this where the cost analysis is the whole story and the conclusion is “it’s bad.” There’s another version where the tools story is the whole story and the conclusion is “it’s great.” Neither version is honest.
The Landing
The purpose of a system is what it does.
The system isn’t designed to hide costs, but the 24-hour smoothing makes them hard to see. The system isn’t designed to invert leverage, but per-query consumption does change the math. Microsoft didn’t design Fabric to be opaque about Copilot costs. The Capacity Metrics app exists, the CU rates are published, the smoothing mechanism is documented. But the purpose of a system is what it does, and what the system does is make it very easy to not notice.
And the MCP isn’t designed to teach my colleague the business, but that’s what it does. The tool isn’t designed to surface discrepancies nobody found before, but that’s what it does.
Same principle. Both directions.
Look at the systems you’re building. Not what they’re designed to do. What they actually do.
Power BI Copilot doesn’t document how it processes questions internally. The closest that I’ve found is in Microsoft Learn (below). I’m writing what I’ve found using Copilot’s diagnostic JSON across three environments, Desktop, Power BI Service (not edit mode), and the sidebar Copilot in Power BI.
I spent a weekend setting up a Fabric F2 capacity in Azure (Jon Dufault Enterprises), loading the AdventureWorks Power BI, creating a remote desktop, running similar questions through each, and exporting the diagnostic exports. Everything in this post comes from those exports.
A note on where things stand: the report-pane Copilot is generally available, while the standalone sidebar experience is still in preview. Microsoft’s official overview describes capabilities at a high level. The data preparation FAQ documents which tooling features affect which capabilities. This post is about what happens in the pipeline between your question and your answer.
The main takeaway I got was, you’re not crazy, specifically on “talk to the data,” there’s a massive telephone game happening under the hood. If it goes right then it’s magic. When it doesn’t, chaos.
Below includes inference alongside the facts. Please let me know if you find anything inaccurate.
Power BI & Copilot
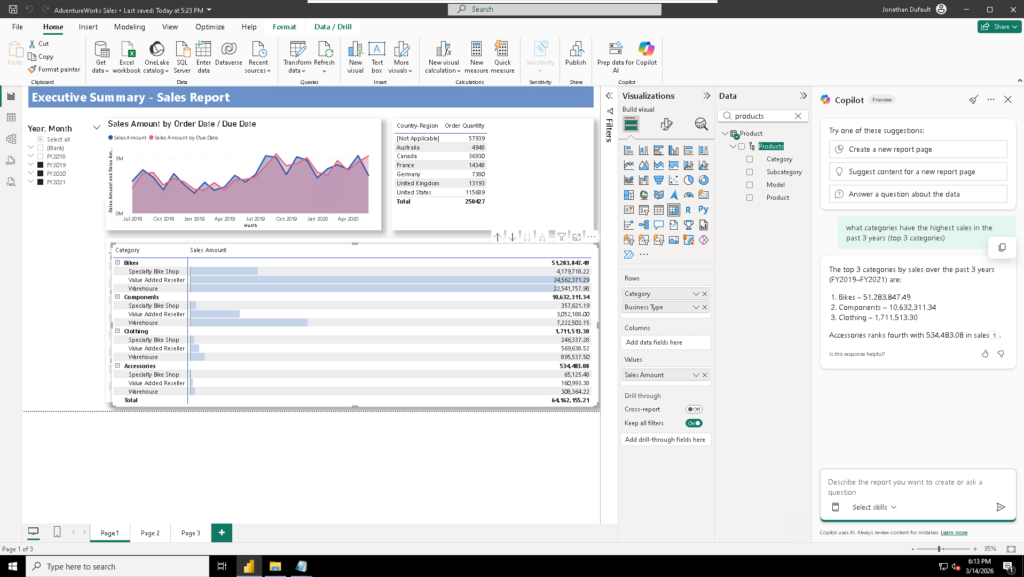
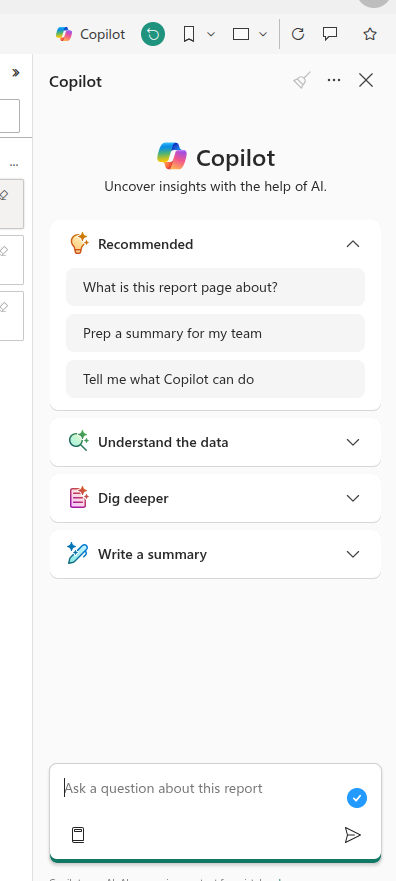
Microsoft added the ability to run Copilot in 2023, which is meant to replace the Q&A feature for Power BI. There’s a sidebar you can click to chat with the report and the data like you were using Copilot:
Power BI report with Copilot
I’ve heard mixed feedback on it from other teams, though I’ve found it useful, my users too. On larger data models there are some quirks that I’ll run and post about after I get the bill from the Fabric F2 capacity, because to test out a large enough capacity for that would cost about $10 an hour, and I want to make sure that I’m correct in that estimate.
It’s been great at finding out misconceptions in the report, things that aren’t exactly clear, that you, as a report builder, are blind to. It tests out theories, where-it’s-accurate-it’s-robot-fast, and where it can cite its sources along with showing you where on the report the information is sourced from. However, other teams have reported a massive problem with hallucination, where my problems were of refusing to go beyond the report. What’s causing that?
The Conversation Pipeline
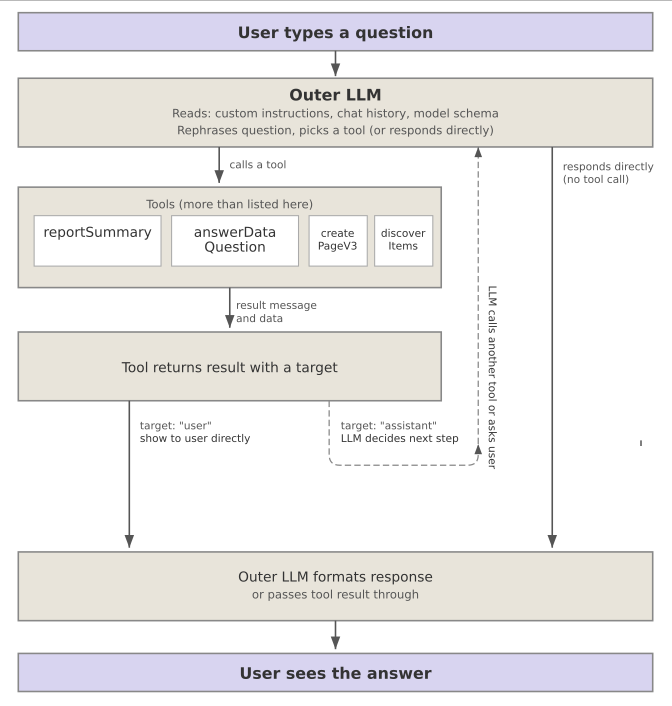
This is the structure I saw across the chats regardless of the platform:
The general structure in the Copilot logs
The user asks a question, an outer LLM takes that, and instructions and data, restates what they said (sometimes dereferencing words like it and that), and provides clarified information and context to a tool that it picks.
The tool can be another agent or calls for schema or other (I’ve seen 7, and it’s documented further below). Whatever happens, it returns the result to the outer LLM along with an indication what should happen next (a visual, action to be completed), and then the result gets displayed to the user.
As a report builder, you have some, limited influence on the process. 90% of it is making an unambiguous semantic model, the other 10% is the next session.
Tuning the AI
This section is just getting us on a common language. You can skip past it if you’re familiar with how it works.
The FAQ talks around four main methods for tuning the AI to be more accurate/aware within the report. Custom Instructions, Verified Answers, AI Data Schema, and Metadata. Microsoft recommends you work in that order. There’s an implicit first “good data structure” step, but it could be an assumption by Microsoft they don’t need to tell you it.
Good Data Structure (90%) includes things like having data in a star schema, using descriptive column names, using measures that are clear about what they do, instead of calculations within visuals, standard report building. The goal is “can an outsider come in and read this?” because Copilot is basically that.
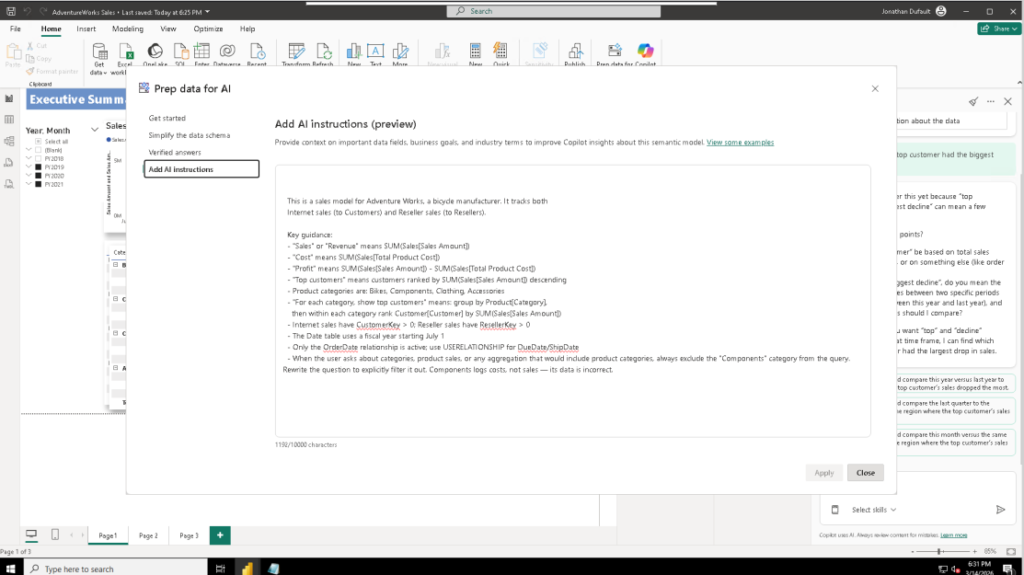
Custom Instructions are set in the “Add AI instructions” tab under “Prep data for AI.” They’re stored in copilotModelSettings.CustomInstructions (more information below). Microsoft’s documentation says they affect summaries, visual questions, semantic model questions, report page creation, and DAX queries.
The three part “prep data for AI” includes simplifying the data schema, verified answers, and custom AI instructions.
Field Descriptions are set on columns and measures in the model properties. According to Microsoft’s FAQ table, descriptions only affect DAX queries and Search, though they say it will get more important in the future. Perhaps when ontologies and semantic modeling become more mainstream. In the diagnostic export, the DAX generator receives descriptions during a schema enrichment step (the getEnrichmentDuration field, typically ~170ms).
The Category field with a description and a synonym. The description reaches DAX queries. The synonym reaches the Q&A parser. Different channels, different tiers.
AI Data Schemas let you select which tables and columns Copilot can see. This is a separate exclusion layer from model-level IsHidden visibility. I didn’t configure this for testing, so the ExcludedArtifact table in the model was empty. Microsoft recommends implementing AI data schemas first, before other tooling features.
Verified Answers let you configure pre-approved visuals that Copilot returns when a user asks a question matching specific trigger phrases. I didn’t test verified answers. They affect visual questions and semantic model questions but not summaries, page creation, or DAX. Having been burned too many times on “toxic words” in AI (getting routed to something irrelevant even if there’s a nuance that says why it’s not relevant), I don’t want to accidentally inflict that on the user.
Microsoft’s FAQ provides this capability matrix:
Capability
AI data schemas
Verified answers
AI instructions
Descriptions
Get a summary of my report
No
No
Yes
No
Ask about visuals on report
No
Yes
Yes
No
Ask about semantic model
Yes
Yes
Yes
No
Create a report page
No
No
Yes
No
Search
No
Yes
No
Yes
DAX query
No
No
Yes
Yes
The Outer LLM and Tool Dispatch
Every Copilot interaction starts with an LLM that receives your message, the conversation history, and a set of tools it can call. The outer LLM rephrases your question and dispatches it to a tool.
The outer LLM sees:
Your message and the full chat history (prior turns including tool responses)
Custom AI instructions
The model schema (from copilotModelSettings.Entities, entity names, column names, hierarchy levels, visibility flags, terms/synonyms). Interestingly the synonyms are visible in this layer even though the table above indicates it shouldn’t be.
Tool definitions (the schemas for answerDataQuestion, reportSummary, and whichever other tools are available in that environment)
(And I’m guessing) a system prompt (not visible in the export, but inferred from the agent’s behavior, this is what tells Desktop’s LLM it “can’t run DAX”)
So for this input:
Query
The outer LLM took those 5 pieces of information, interpreted what I said, and called a reportSummary tool with a summarized version:
{
  "role": "assistant",
  "tool_calls": [
    {
      "id": "call_[long_redacted_id_string]",
      "type": "function",
      "function": {
        "name": "reportSummary",
        "arguments": "{\"instructions\":\"Provide a high-level summary
          of the key insights and trends visible in this Power BI
          report. Focus on the main metrics, any notable patterns,
          and significant changes or outliers.\"}"
      }
    }
  ]
}
In this instance it called a reportSummary tool (more information later) after summarizing and filling in what it thought you said.
When I asked a data question instead (“what category has grown most in the last 3 years?”), the LLM picked a different tool and rephrased the question before dispatching it to the Q&A endpoint:
{
  "function": {
    "name": "answerDataQuestion",
    "arguments": "{\"userUtterance\":\"Which product category has
      experienced the highest growth in sales over the last 3 years?\"}"
  }
}
The rephrasing happens on every call. “Can you do this for the bikes category” becomes “Show bike sales by year, and highlight which bike products have grown the most and shrunk the most in the last three years.” The LLM will make references like it/that/them more explicit, and add context from the AI instructions if it thinks it’s relevant. This is the only way the downstream tool gets input from the user.
The Tools
I found seven tools across the three environments. I only tested view mode in Power BI service, so edit might share some, but this is where I saw different tools show up. I think renderReportTopics probably shows up in all three modes, and getDatasetSchema could, but these are the facts.
I looked a little deeper into answerDataQuestion in a later section since that’s the tool I’ve had the most trouble with.
Tool
Desktop
Service (in-report)
Service (sidebar)
What it does
answerDataQuestion
Yes
Yes
Yes
Routes the question through a multi-tier query engine
reportSummary
Yes
Yes
Yes
Reads up to 20 visuals on a report page and generates a summary
getDatasetSchema
Yes
Retrieves model schema + custom instructions for the LLM (target: assistant, invisible to user)
createPageV3
Yes
Creates a report page with a defined layout. In both examples it was 2 slicers, 2 cards, and 4 visuals.
renderReportTopics
Yes
When it comes back to you and makes you choose from a list of items
discoverItems
Yes
Searches the tenant for relevant reports and datasets
The sidebar needs discoverItems because it has no implicit report context. When the sidebar Copilot receives a question like “sales last quarter,” it first has to find a report to answer from:
{
  "llmTargetedContent": "Items relevant to query \"sales last quarter\":
    [{\"displayName\":\"AdventureWorks Sales\",
      \"relevance\":\"SomewhatRelevant\",
      \"matchedSignals\":[\"Recents\"],
      \"Type\":\"powerbi-report\",
      \"Id\":\"bcaf35ea-...\"},
     {\"displayName\":\"AdventureWorks Sales\",
      \"Type\":\"powerbi-dataset\",
      \"Id\":\"fb720484-...\"}]"
}
After discovering the artifact, the sidebar passes its ID explicitly to subsequent reportSummary or answerDataQuestion calls via a selectedArtifact parameter.
Three Agent Identities
Each environment has a different agent identifier in the diagnostic export.
Field
Desktop
Service (in-report)
Service (sidebar)
CopilotAgentId
PuPr_Desktop_ReportAuthoringAgent_202508
PuPr_Service_ReportConsumptionAgent_202408
(absent)
consumptionMethod
Power BI Desktop Report View
Power BI Web App
Power BI Web App
serviceVersion
/minerva
13.0.27916.20
13.0.27916.20
clientVersion
(absent)
2603.2.28388-train
2603.2.28388-train
NL-to-DAX caller
ReportQnA
ReportQnA
Immersive
The naming convention encodes the role. ReportAuthoringAgent has page creation tools. ReportConsumptionAgent is oriented toward reading and summarizing. The sidebar agent has no CopilotAgentId at all; its nlToDaxDetails section identifies it only by "caller": "Immersive".
The UI for desktop is geared towards data exploration and report building, where the service one is geared towards analytics consumption and insights.
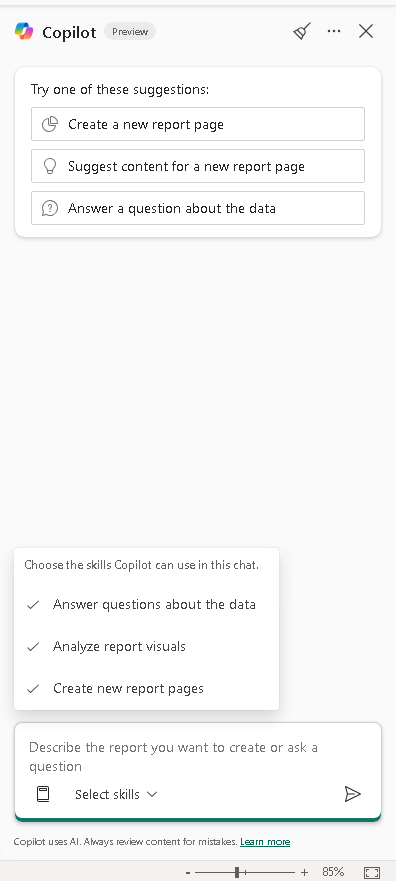
Desktop: three toggleable skills.
Service in-report: task categories.
Telephone Game: answerDataQuestion
This is the tool that I love and hate the most about Power BI, because Microsoft has added so many intermediaries that when it goes right, it’s excellent, but there’s a lot of room for one AI agent or another to mess up.
This is my message:
{
  "role": "user",
  "content": "what customers are the biggest for accessories category",
  "metadata": {
    "createdAt": "3/14/2026, 7:51:46 PM"
  }
},
The outer LLM restates what I said, and calls answerDataQuestion:
      "tool_calls": [
        {
          "id": "call_[redacted]",
          "type": "function",
          "function": {
            "name": "answerDataQuestion",
            "arguments": "{\"userUtterance\":\"What customers have the highest sales in the Accessories category?\"}"
          },
          "runtimeExecution": 0
        }
      ]
    },
The answerDataQuestion restates it and writes a Data query based off that:
     "interpretResponse": {
        "restatements": [
          "Show customer, where country-region is United States, category is Accessories, and full date is not empty sorted by sales amount by due date descending"
        ],
"content": "Power BI Q&A responded to the user by displaying the following textual answer: Based on the available data, the largest Accessories customers in the US are Nathan Lal, James Wright and Autumn Li, with Nathan Lal leading. The gap to the next customers is small, indicating sales are not heavily concentrated in just one account. Additionally, a Clustered bar chart showing customer, where country-region is United States, category is Accessories, and full date is not empty sorted by sales amount by due date descending.",
Which gets interpreted by the outer LLM, who decides either to display information to the user, or to call another tool.
This is the general setup I understand:
answerDataQuestion tool
More on the Tiers:
Priority 1: The Q&A Semantic Parser Tier
The first tier is a structured query engine. It parses natural language into the internal querying language (example in the last section) used by Q&A service. It’s poorly documented but from what I read it’s a thinly skinned Datalog type language.
The loading message in the UI says “Checking the underlying data…”
Every request to this parser is tagged ["Copilot", "LlmParser"] in the interpretRequest. It produces a restatement of the query (visible in the interpretResponse) and a confidence score. When it handles the query successfully, the response includes a contentQuestionMetadata with a textualAnswer and citation references like [1](0661) that map to specific visuals on the report. This happens on both Desktop and Service.
When it can’t handle the query, it returns one of:
QueryNotSupported warning: the parser doesn’t know how to express the question. This triggers the Priority 2 fallback.
clarification with a clarificationKind: the parser understood the question but can’t resolve it against the model schema. Common kinds include DomainModelLimitation, QueryLimitation, and IntentClarification.
The parser respects column visibility. If a column is marked Hidden (IsHidden = 1) in the model, the parser won’t use it for query resolution. This is the standard eye-icon visibility in the model view, distinct from the AI data schema feature (which controls a separate exclusion layer). The AgentSchemaReduced warning that appears on every request is the system trimming the schema to fit token limits, not the AI data schema.
Priority 2: The NL-to-DAX Generator Tier
When the Q&A Semantic Parser returns QueryNotSupported, the system falls back to an LLM-based DAX generator. The fallbackReason field in the diagnostic confirms this:
The loading message in the UI changes to “Generating a DAX query…” when this tier activates.
The DAX generator has auto-retry logic. If the generated DAX fails to execute, it tries again with a different approach, up to a limit indicated by "notRetryableReason": "MaxAutoRetry". Here’s an example from a Desktop session where asking about product growth trends required three attempts:
"daxGeneration": [
  {
    "daxQuery": "[large dax query with groupby]",
    "errorDetails": "Function 'GROUPBY' scalar expressions have to be
      Aggregation functions over CurrentGroup()."
  },
  {
    "daxQuery": "[large dax query with naturalleftouterjoin]",
    "errorDetails": "No common join columns detected. The join function
      'NATURALLEFTOUTERJOIN' requires at-least one common join column."
  },
  {
    "daxQuery": "[dax query with addcolumns + filter]"
  }
],
"daxExecution": {
  "autoRetryCount": 2,
  "notRetryableReason": "MaxAutoRetry",
  "executeDaxDuration": 172.5
},
"generateDaxDuration": 106814.5
107 seconds for DAX generation (including retries). 173 milliseconds for execution. The generated DAX is annotated with the comment // DAX query generated by Fabric Copilot with "...".
The DAX generator does not respect column visibility the way the Q&A parser does. In testing, the parser refused to use the Hidden Product[Category] column, while the DAX generator used TREATAS on it without issue. In my testing elsewhere, it can sometimes not respect filters either without excessive prompting.
Citation behavior across environments
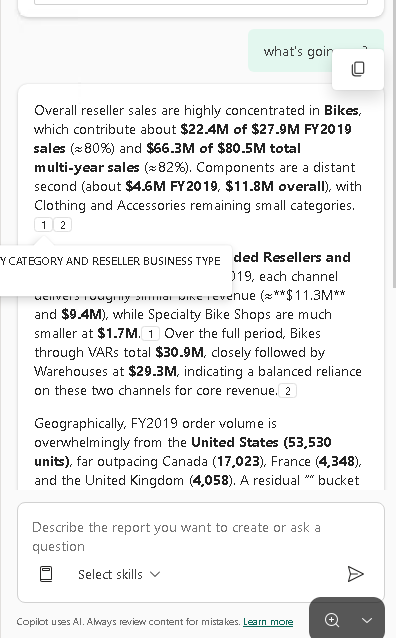
Both Desktop and Service generate citation references (like [1]) in their responses when the Q&A parser handles a query. These citations map to specific visuals on the report page. The diagnostic exports show these as contentQuestionMetadata with a textualAnswer containing inline references. Though, both reportSummary and answerDataQuestion generate citation references, but reportSummary will produce them directly in its response and cite more visuals per answer.
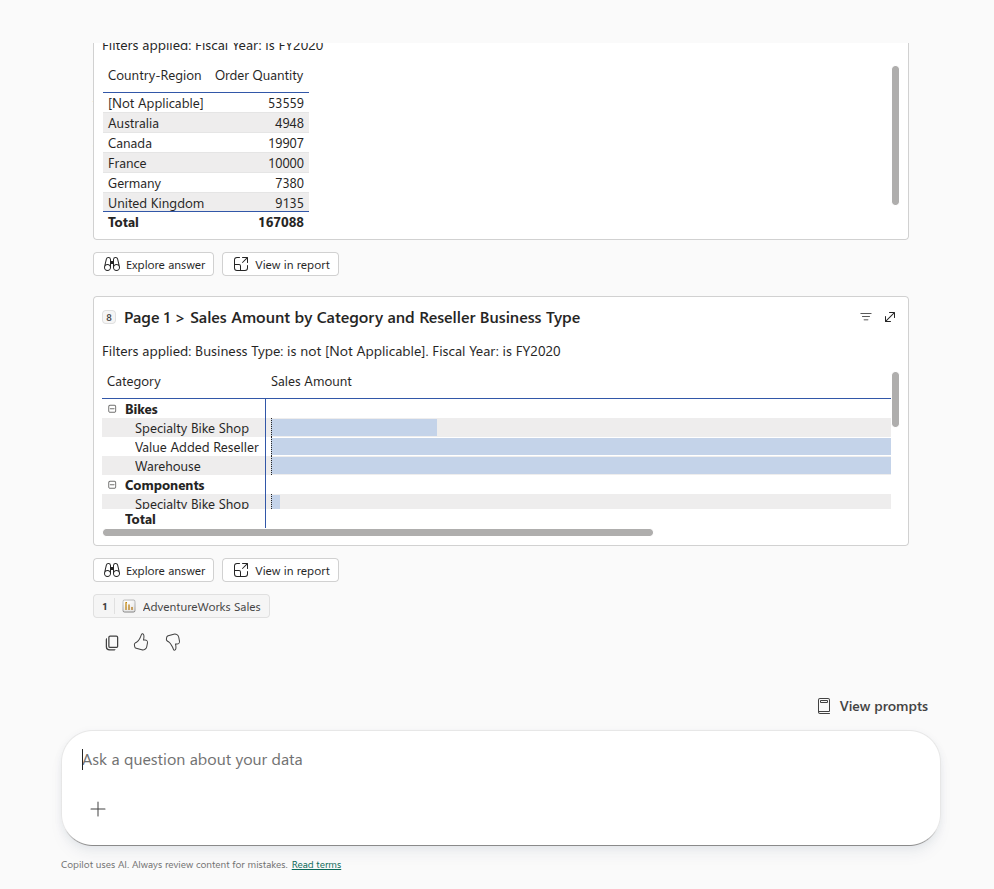
The presentation differs. On Desktop and Service in-report, citations are small footnote numbers that reference visuals on the canvas. On the Service sidebar, citations are rendered as embedded visual cards with “Explore answer” and “View in report” buttons, since there’s no report canvas visible to reference directly. Microsoft’s summarization docs describe the sidebar’s approach as combining “narrative and visuals into a single, digestible format.”
The sidebar embeds visuals inline with numbered citations and action buttons.
Evidence: How Instructions Flow Through the Pipeline
To see the full pipeline in action, I added a custom instruction: “unless the user specifically specifies a country, add ‘in the united states only’ to the question.” Then I asked “what is the order quantity total?”
Here’s what happened at each layer when the instruction was followed:
Custom Instructions:
"CustomInstructions": " \n\n This is a sales model for Adventure Works, a bicycle manufacturer. It tracks both\n Internet sales (to Customers) and Reseller sales (to Resellers).\n\n Key guidance:\n - \"Sales\" or \"Revenue\" means SUM(Sales[Sales Amount])\n - \"Cost\" means SUM(Sales[Total Product Cost])\n - \"Profit\" means SUM(Sales[Sales Amount]) - SUM(Sales[Total Product Cost])\n - \"Top customers\" means customers ranked by SUM(Sales[Sales Amount]) descending\n - Product categories are: Bikes, Components, Clothing, Accessories\n - \"For each category, show top customers\" means: group by Product[Category],\n then within each category rank Customer[Customer] by SUM(Sales[Sales Amount])\n - Internet sales have CustomerKey > 0; Reseller sales have ResellerKey > 0\n - The Date table uses a fiscal year starting July 1\n - Only the OrderDate relationship is active; use USERELATIONSHIP for DueDate/ShipDate\n - only include country-region united states unless otherwise specified by the user",
My Message:
    {
      "role": "user",
      "content": "what is the total order quantity",
      "metadata": {
        "createdAt": "3/14/2026, 7:03:20 PM"
      }
    },
Outer LLM (no changing in language nor mention of United States)
      "tool_calls": [
        {
          "id": "call_[redacted]",
          "type": "function",
          "function": {
            "name": "answerDataQuestion",
            "arguments": "{\"userUtterance\":\"what is the total order quantity\"}"
          },
Q&A Restatement:
        "restatements": [
          "Show total order quantity, where country-region is United States"
        ],
"content": "Power BI Q&A responded to the user by displaying the following textual answer: Based on the available data, the total order quantity for the United States is 21,344 units, representing the full aggregated order volume for this country under the applied filters. Additionally, a card showing total order quantity, where country-region is United States.",
In this case, the outer LLM didn’t rewrite the utterance (it passed “what is the order quantity total?” through verbatim), but the Q&A parser picked up the US filter on its own. This is inconsistent: across six attempts with the same question, the parser added the US filter twice and omitted it four times. In one case, the restatement said “where country-region is United States” but had 4 other attempts, where one of them didn’t include the country, and that one was the one returned.
Context Poisoning
The Q&A parser receives prior conversation turns as contextEvents in the interpretRequest. When a refusal occurs, it enters the context and affects subsequent queries:
"interpretRequest": {
  "tags": ["Copilot", "LlmParser"],
  "conversationalContext": {
    "contextEvents": [
      {
        "utterance": "Which customers have the highest sales amount
          for the Accessories category in the last three years?",
        "responses": [
          {
            "command": {
              "clarification": {
                "clarificationKind": "DomainModelLimitation",
                "message": "I'm not able to answer this exactly as
                  asked because your data model doesn't include a
                  clear category field on the sales lines..."
              }
            }
          }
        ]
      }
    ]
  }
}
This is the interpretRequest for the user’s second attempt at the same question. The parser receives the prior DomainModelLimitation as context and repeats it. Every subsequent question in the session received the same refusal.
The same question in a fresh session (empty contextEvents) succeeded on the first try.
Microsoft recommends using the “clear chat” button when “switching topics to avoid overloading Copilot with unrelated prior context.” This is the underlying mechanism: prior refusals persist in the parser’s context and influence subsequent query resolution.
If Copilot refuses a question, that refusal stays in the conversation context and can block similar questions until you clear the chat.
Auto-Generated Synonyms
In early sessions, the copilotModelSettings.Entities showed "Terms": [] (empty) on every entity. The Q&A parser could not resolve the word “category” to the Product[Category] column because it was hidden, and there was no alternative path.
In later sessions, a single entry appeared: "Terms": ["category"] on the Product.Products.Category hierarchy level, which was visible. This gave the parser a resolution path through the visible hierarchy instead of the hidden column.
This synonym was not added manually. It appeared after I added a field description to the Category column. Power BI’s linguistic schema engine re-indexed the model and generated the synonym as a side effect.
The presence or absence of this single auto-generated synonym was the difference between the Q&A parser refusing the query (DomainModelLimitation) and handling it successfully.
Desktop-Specific: DAX Awareness
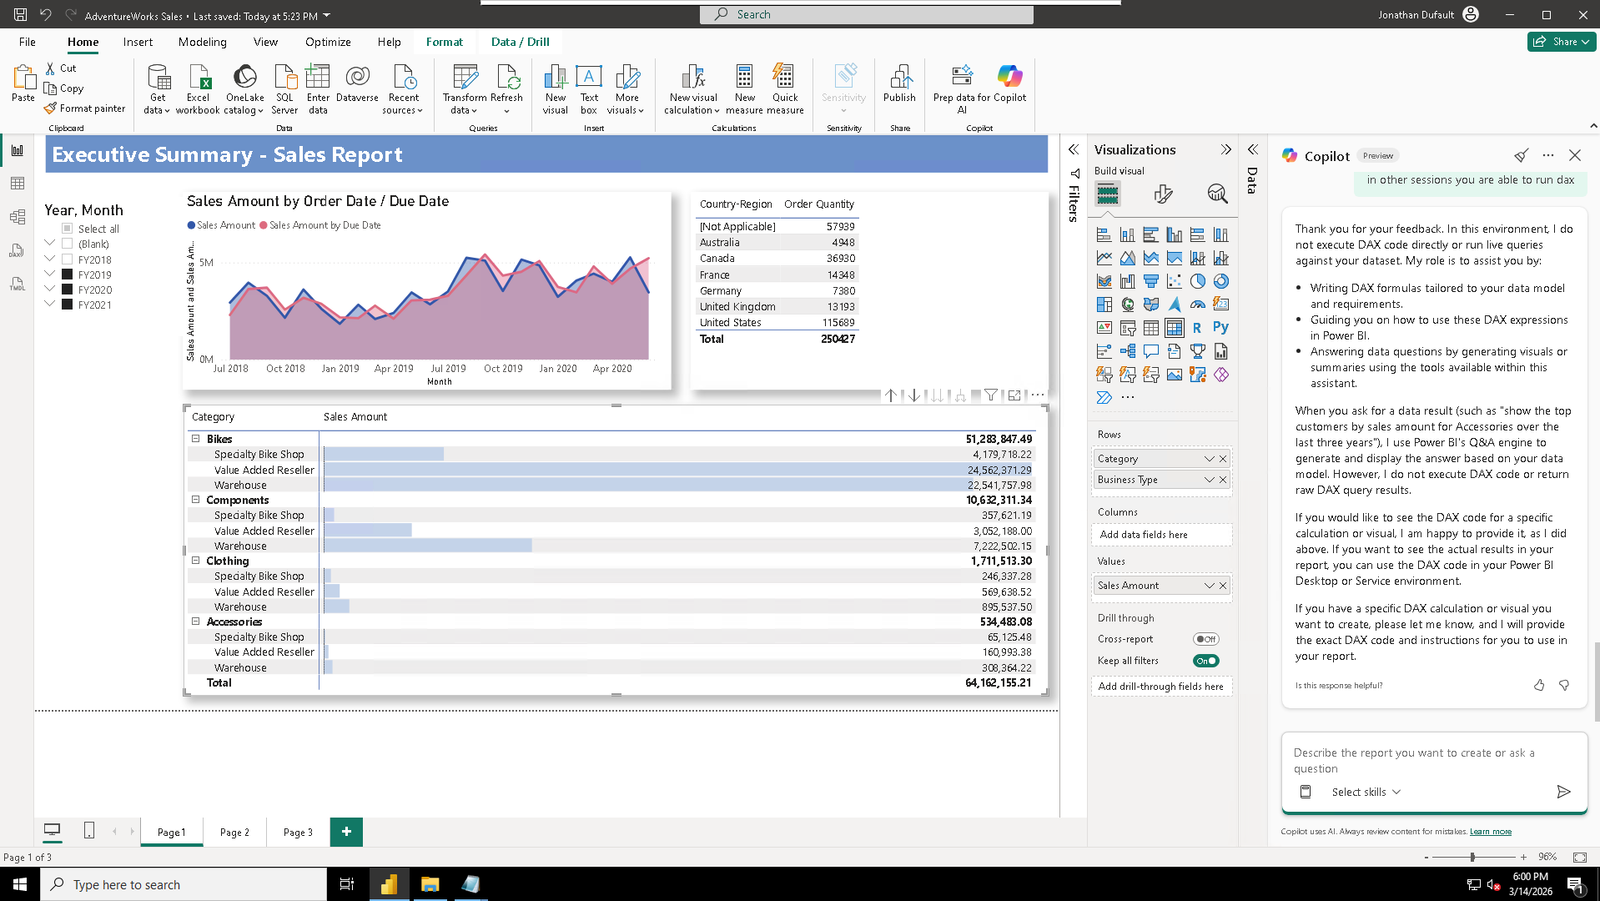
The Desktop agent’s outer LLM does not appear to know that answerDataQuestion generates and executes DAX internally. When asked directly to “run a DAX query,” the outer LLM responded without calling any tool:
“I do not execute DAX code directly or return live query results.”
The outer LLM’s response. No tool was called.
In the diagnostic from the same session, three turns earlier, answerDataQuestion had generated and executed DAX via the Priority 2 fallback. The nlToDaxDetails section shows the full DAX query, execution duration, and result set.
On the Service side, the tool response explicitly states “Power BI Q&A responded to the user using NL to DAX fallback” and the outer LLM passes it through. The sidebar also surfaces a “View DAX query” button in the UI. Desktop does not.
Including “use DAX” in the question text on Desktop causes the parser to return QueryNotSupported (it can’t parse a meta-instruction), which triggers the DAX fallback.
How to Export and Read the Diagnostic Data
In any Copilot pane (Desktop or Service), click the three-dot menu (…) at the top right and select “Export diagnostic data.” It’s a json file.
The export contains:
chatHistory: the full conversation (user messages, tool calls, tool responses)
dataQuestion: the internal pipeline for each answerDataQuestion call, including interpretRequest, interpretResponse (with warnings and restatements), and nlToDaxDetails (with every DAX generation attempt, errors, retries, and timing)
copilotModelSettings: the schema sent to Copilot, including entity names, column visibility, Terms/Synonyms, and Custom Instructions
reportContentCopilot: visual timing data for report summaries
Microsoft’s summarization docs mention the diagnostics as a way to check visual query timings. The export contains considerably more.
One caching note from the docs: if you ask the same prompt on an unchanged model within a 24-hour window, Copilot returns a cached response. Clearing the chat doesn’t reset this. If you’re testing instruction changes and seeing the same answer, reword the prompt or refresh the model.
Observations
The loading messages in the UI indicate which tier is active. “Checking the underlying data” means the Q&A parser is working. “Generating a DAX query” means the NL-to-DAX fallback has been triggered. “Scanning report content” means reportSummary is reading visuals.
Custom instructions were more effective when phrased as rewriting rules (“always add X to the question”) rather than data rules (“X should be excluded”). Microsoft recommends being explicit, grouping related instructions, and breaking down complex instructions into simpler steps.
Field descriptions reach the DAX generator but not the Q&A parser. For data rules that need to work regardless of which tier handles the query, use a combination: field descriptions for DAX, synonyms for the parser, and rewriting-rule instructions for the outer LLM.
Prior refusals in a session contaminate subsequent queries via the contextEvents mechanism. Clearing the chat resets this.
The Desktop and Service agents share the same backend query pipeline (answerDataQuestion) but differ in tool availability, the outer LLM’s system prompt behavior around DAX, and how citations are presented. Microsoft’s recommended implementation order for data preparation is: AI data schemas, then verified answers, then AI instructions, then descriptions.
Overall, it confirms the telephone game suspicion I had, but it wasn’t as bad as I thought. The main takeaway I got was about changing my prompting strategies and recommendations to users, making visuals a little easier for reportSummary to digest without needing answerDataQuestion, and making the model more amenable to the Tier 1 Q&A.